Note
Go to the end to download the full example code.
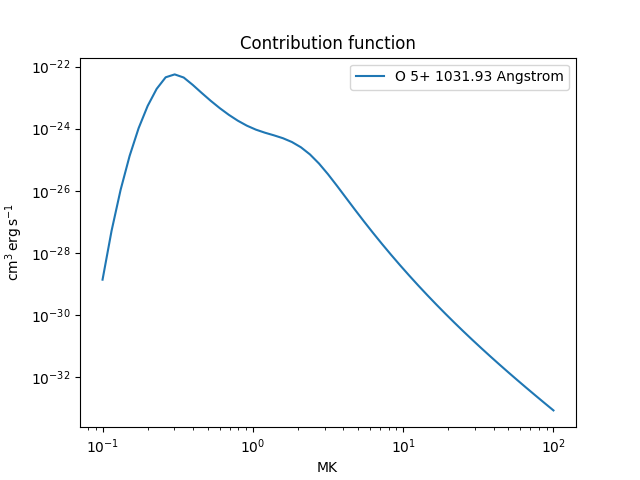
Calculating a contribution function#
This example shows how to calculate the contribution function of a particular transition of O VI as a function of temperature at a given density.
import astropy.units as u
import matplotlib.pyplot as plt
import numpy as np

from astropy.visualization import quantity_support

from fiasco import Ion

quantity_support()
<astropy.visualization.units.quantity_support.<locals>.MplQuantityConverter object at 0x7ce9ee315fd0>
Specify the plasma properties; note that an Ion has to be created with a
range of temperatures, but the density is only used later in the contribution
function calculation.
Te = np.geomspace(0.1, 10, 26) * u.MK
ne = 1e8 * u.cm**-3
Create the ion object
ion = Ion('O 5+', Te)
print(ion)
CHIANTI Database Ion
---------------------
Name: O 6
Element: oxygen (8)
Charge: +5
Isoelectronic Sequence: Li
Number of Levels: 923
Number of Transitions: 25876

Temperature range: [0.100 MK, 10.000 MK]

HDF5 Database: /home/docs/.fiasco/chianti_dbase.h5
Using Datasets:
  ionization_fraction: chianti
  abundance: sun_coronal_1992_feldman_ext
  ip: chianti
Calculate the contribution function
contribution_func = ion.contribution_function(ne)
WARNING: No proton data available for O 6. Not including proton excitation and de-excitation in level populations calculation. [fiasco.ions]
WARNING: No proton data available for O 7. Not including proton excitation and de-excitation in level populations calculation. [fiasco.ions]
Because the contribution function is calculated for all transitions at once, we need to get the index of the transition closest to the specified wavelength.
wavelength = 1031.92 * u.Angstrom
transitions = ion.transitions.wavelength[ion.transitions.is_bound_bound]
idx = np.argmin(np.abs(transitions - wavelength))
Plot the result
plt.plot(Te, contribution_func[:, 0, idx],
         label=f'{ion.atomic_symbol} {ion.charge_state}+ {wavelength:latex}')
plt.title('Contribution function')
plt.xscale('log')
plt.yscale('log')
plt.legend()
plt.show()
Total running time of the script: (0 minutes 37.905 seconds)