Note
Go to the end to download the full example code
Ionization fractions in equilibrium#
This example shows how to compute the ionization fraction as a function of temperature, assuming equilibrium, for both a single ion as well as a whole element.
import astropy.units as u
import matplotlib.pyplot as plt
import numpy as np

from astropy.visualization import quantity_support

from fiasco import Element

quantity_support()
<astropy.visualization.units.quantity_support.<locals>.MplQuantityConverter object at 0x7f5c98501c90>
First, create the Element object for carbon.
temperature = 10**np.arange(3.9, 6.5, 0.01) * u.K
el = Element('C', temperature)
The ionization fractions in equilibrium can be determined by calculating the
ionization and recombination rates as a function of temperature for every
ion of the element and then solving the associated system of equations.
This can be done by creating a Element object and then accessing
the equilibrium_ionization property.
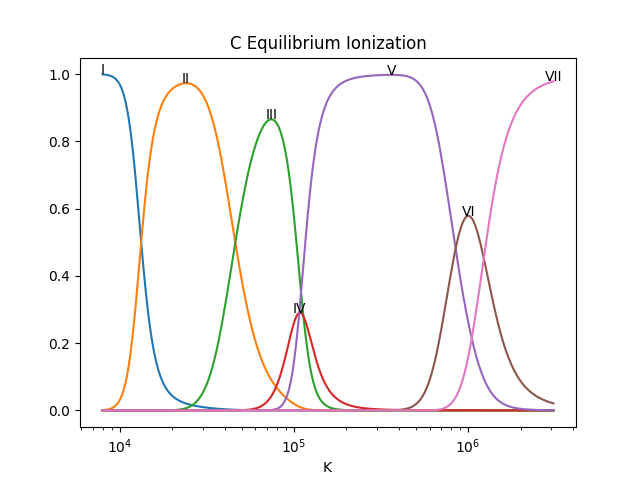
We can use this to plot the population fraction of each ion as a
function of temperature.
for ion in el:
    ioneq = el.equilibrium_ionization[:, ion.charge_state]
    imax = np.argmax(ioneq)
    plt.plot(el.temperature, ioneq)
    plt.text(el.temperature[imax], ioneq[imax], ion.ionization_stage_roman,
             horizontalalignment='center')
plt.xscale('log')
plt.title(f'{el.atomic_symbol} Equilibrium Ionization')
plt.show()
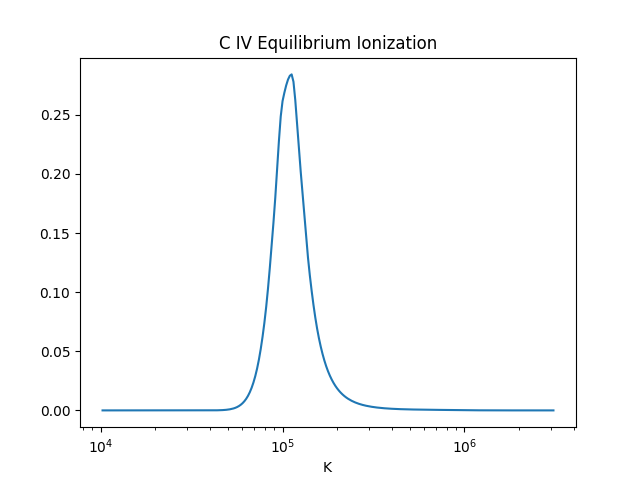
The CHIANTI database also includes tabulated ionization equilibria for
all ions in the database. The ioneq attribute on each
Ion object returns the tabulated population
fractions interpolated onto the temperature array.
Note that these population fractions returned by ioneq are
stored in the CHIANTI database and therefore are set to NaN
for temperatures outside of the tabulated temperature data given in CHIANTI.
plt.plot(el.temperature, el[3].ioneq)
plt.xscale('log')
plt.title(f'{el[3].ion_name_roman} Equilibrium Ionization')
plt.show()
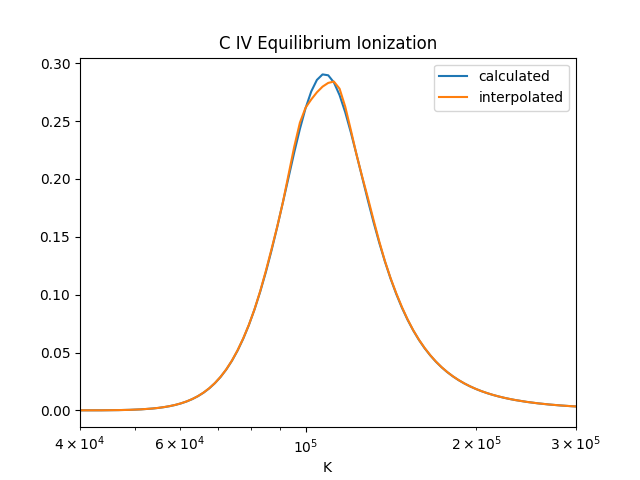
We can then compare tabulated and calculated results for a single ion. Note that the two may not be equal due to differences in the rates when the tabulated results were calculated or due to artifacts from the interpolation.
plt.plot(el.temperature, el.equilibrium_ionization[:, el[3].charge_state], label='calculated')
plt.plot(el.temperature, el[3].ioneq, label='interpolated')
plt.xlim(4e4, 3e5)
plt.xscale('log')
plt.legend()
plt.title(f'{el[3].ion_name_roman} Equilibrium Ionization')
plt.show()
Total running time of the script: (0 minutes 0.953 seconds)